
Ethereum, which was launched in 2015, is the second largest cryptocurrency after Bitcoin in terms of market capitalization. It was trading sideways for two years, at around $ 10, until 2017. That was the year of the “Gold Rush” for cryptocurrencies, and the ETH price started to increase in March. The ETH/USD had jumped to $ 50 by the end of that month, which meant a 500% increase. That was a sign that the market was changing, and a wave of buying was coming. We saw a retrace in July and September, but that year turned out to be extraordinary for digital currencies overall.
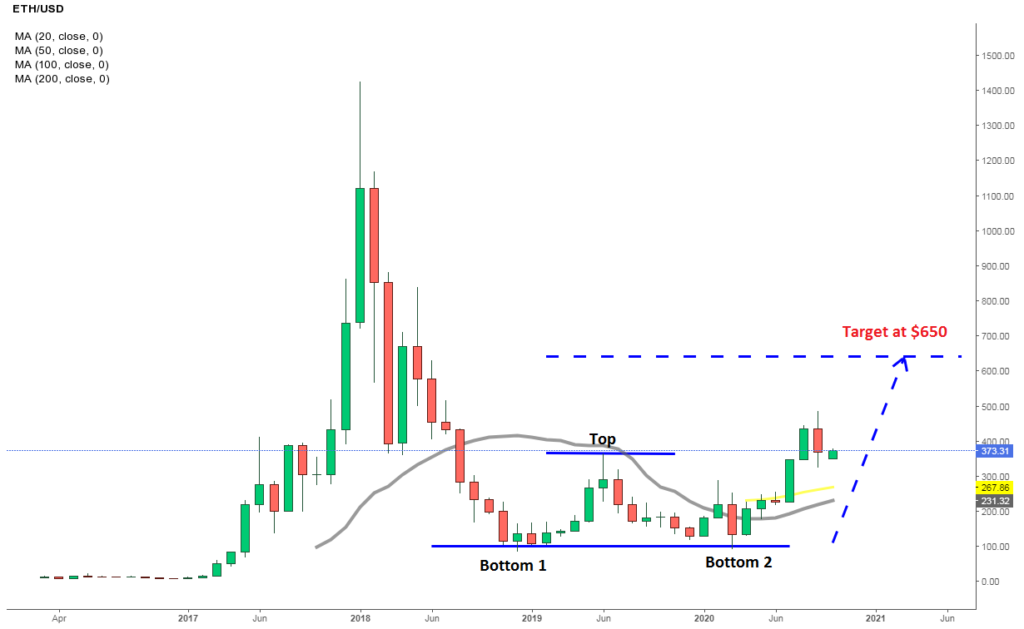
The double top pattern points to $ 650 for Ethereum
Ethereum surged to $ 1,425 by January 2018 and closed at $ 1,120. 2018 turned out to be the opposite of the previous year, as the Gold Rush ended and the crypto market started reversing back down. Although, that wasn’t a big surprise, given the extraordinary and sudden surge in 2017. The decline in 2018 was also quite straightforward, with 8 bearish monthly candlesticks. In the first half of 2019 and in January this year, buyers have tried to reverse the price higher, but they were short-lived both times, showing that the pressure remained to the downside for Ethereum, as highs were getting lower. We saw another attempt to the downside in March, when the coronavirus broke out in Europe, turning traders to the USD. But the support below $ 100 held once again, and since April, Ethereum has been increasing, getting pretty close to $ 500 in September.
With the two attempts at $ 80 to $ 90, and the consecutive failures to break below that level, we can see that a double bottom pattern has formed in the ETH/USD. The high in June last year came at $ 370, so the target from the top should be as big as the distance between the bottom and the top. That means that Ethereum should increase another $ 280 above $ 370, to $ 650, if the double bottom pattern is to work out. The price has moved above June’s high now, which was the high point of this pattern. That validates the pattern, so $ 650 is really the target now, and our Ethereum price prediction from the monthly chart analysis points to this level.
Ethereum Analysis Off the Weekly Chart – Third Time Lucky?
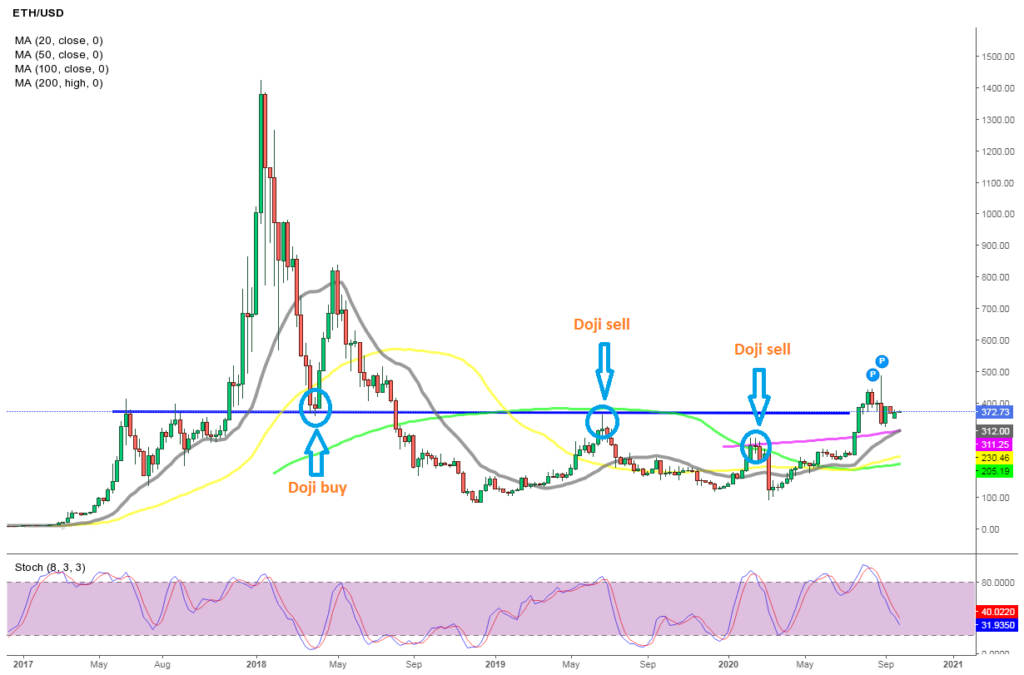
On the weekly chart, the price was finding solid support at the 20 SMA (gray) during the uptrend in 2017. Ethereum formed a resistance zone around $ 400, and buyers were finding it hard to push above that level. But the 20 SMA kept pushing the price higher, and eventually the resistance at 400 was broken. This level was quite important for Ethereum, since it turned into the ultimate support and resistance zone, as we will see further below in this Ethereum price prediction.
The next bullish leg should start soon
As we know, the ETH/USD surged to $ 425, where it remained until December that year, but then the reversal came and the price crashed lower. The 20 SMA held in the first attempt in the second week of February, despite being pierced, but it was eventually broken. However, the previous resistance zone at around $ 400 turned into support this time, and after a small doji candlestick above that level, we saw a retrace higher to $ 840. The price pushed above the 20 SMA briefly, but then reversed down and fell below all moving averages, until it reached $ 80 at the end of 2018. As we mentioned above, the ETH price increased during H1 of 2019, but the area around $ 400 turned into resistance again, with a bit of help from the 100 SMA (green). The price formed a doji here, which is a bearish reversing signal after the retrace higher, at which point the price turned lower.
The second upward retrace took place during Q4 of 2019, as the sentiment for cryptocurrencies improved, but the retrace ended after a doji candlestick at the top once again, just below $ 300. This time, the 200 SMA (purple) provided resistance. Both times, the stochastic indicator was oversold, also indicating a reversal down. This time though, the bullish move since the middle of March doesn’t look like a retrace. The price has moved above the $ 400 level and moving averages are now turning into support, suggesting that the pressure has turned to the upside for Ethereum. In the last few weeks, we have seen a consolidation at around $ 400, but the stochastic indicator is approaching the oversold area, and the moving averages are getting closer, so the Ethereum analysis tells us that the next bullish leg is expected in Ethereum soon, although it will also depend on the sentiment in the crypto market.
Ethereum Analysis Off the Daily Chart – Buyers are Back in Control
There’s a lot more noise on the daily time-frame chart and the volatility looks much higher in lower time-frame charts, although they still show the market behavior, and we can spot the trends. During 2019, the ETH price was trading in a range, which showed consolidation, although the bias was bearish, as highs were getting lower, but at least we were not seeing any new lows. Moving averages lost significance, as they were broken many times, but they helped indicate buying or selling opportunities, as the price was moving up or down in this consolidation period.
Ethereum is trying to break the 20 and 50 SMAs now
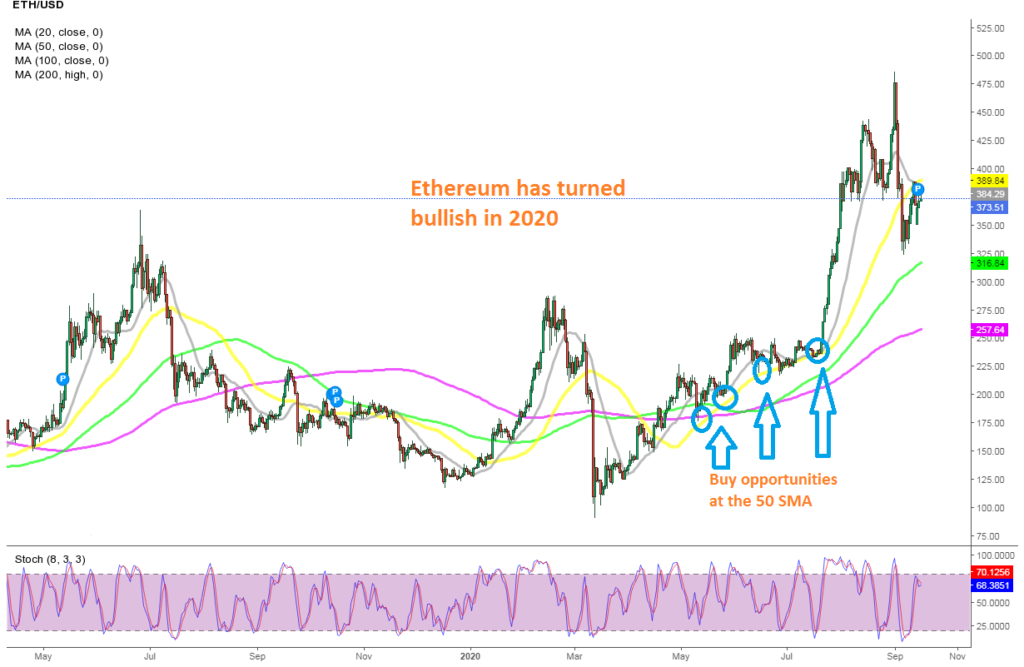
But now, it seems like the consolidation period has ended and buyers have come back onto the scene. The crash from the initial coronavirus panic ended pretty quickly and the price reversed higher, surging more than $ 150 until June, then a consolidation period followed. The bullish momentum retumed, lasting until September 1, taking the ETH price to $ 485, while now, according to the Elliott Wave Pattern, we are in another pullback/consolidation period, before the next bullish leg starts.
During the bullish move of the last few months, the 50 SMA (yellow) did a good job as support, pushing the price higher, and the 20 SMA also helped occasionally on the daily chart. The involvement of smaller moving averages, as support indicators, shows that the pace of the bullish trend was quite strong. So, the third bullish leg should start soon, and it might have already started, but the 20 and 50 SMAs are standing on top now, and they rejected the price initially. However, the price turned back to them pretty quickly, indicating buying pressure, so it will only be a matter of time before these moving averages break. Therefore, the price action in this time-frame also points up and the Ethereum analysis from this time-frame is $ 650 for several months ahead.